
Mark’s Power Play: The Hike Landed. Now the Wall Arrives.
September 29, 2026
The Hike Landed. Now the Wall Arrives.
Summer Street Advisors | October 2026 Capital Markets Outlook
Last month, I observed that liquidity was returning to the market, but conviction remained constrained. The Fed’s next move was still an open question. It no longer is.
On September 16th, the Fed raised its benchmark rate by 25 basis points, bringing the target range of 3.75% to 4.00%, in its first hike in three years. The decision was unanimous. Chair Warsh was direct about why: “The plain fact is that inflation is too high, and has been for too long.” The committee may not be finished. Most policymakers anticipate at least one more hike before year-end. The next decision is October 28th.
What the market is actually financing
The headlines since mid-September capture the divergence identified a month ago – and how it is playing out in actual transactions.
Scale capital is still moving for the right assets. A major institutional sponsor is closing a large CMBS refinancing on a well-leased, multi-state industrial portfolio. Structured as floating-rate and non-recourse, it is the kind of financing that gets done when a sponsor is confident enough in in-place cash flow to take rate risk rather than lock in today’s long-end pricing. It is one of several sizable industrial and data-center financings that same sponsor has priced this year.
Life companies are selectively returning to underwriting well-leased office. A major life insurer recently refinanced a well-located Manhattan office tower shortly after its anchor tenant signed a long-term lease extension, in a submarket where rents are rising and vacancy is falling. Leased, well-located office is getting financed again. Half-empty office in a soft submarket is a different conversation entirely.
The other side of that conversation is becoming louder. One alternative-investment CEO recently described a “primal scream from commercial real estate” building among owners refinancing at roughly double their original rate, enough to add hundreds of thousands of dollars a year in interest on a single property. We’d caution against treating any one commentator’s numbers as market-wide fact, but the underlying mechanism is real: assets financed years ago at low rates are rolling into a market that no longer assumes rates are heading down.
The lending landscape: Selectivity matters
CBRE’s Lending Momentum Index stood at 1.0 at the end of Q2, remaining historically elevated, but down from 1.3 a year earlier and off the five-year high set in Q1. The composition matters more than the headline figure: debt funds increased their share of non-agency loan closings to 38%, while CMBS lenders’ share declined to 11% from 19%.
The divergence by property type has sharpened. Net lending to multifamily rose nearly 16% year-over-year through Q1, while lending to non-multifamily commercial property nearly stalled. Capital has not left the market. It is becoming more concentrated.
The maturity wall is now a Q4 story
The September note flagged $76.6 billion in CMBS hard maturities for 2026, with 36% sitting at debt yields of 8% or below. More granular data now clarifies where the stress sits. Of the roughly $65 billion in private-label CMBS maturing in the second half of the year, Trepp’s loan-level analysis of a $15.1 billion hard-maturity sample found that 206 loans totaling $8.1 billion in outstanding balances would require fresh borrower equity to refinance, with $5.6 billion of those balances requiring a cash-in of 20% or more. Office carries the largest share of that gap.
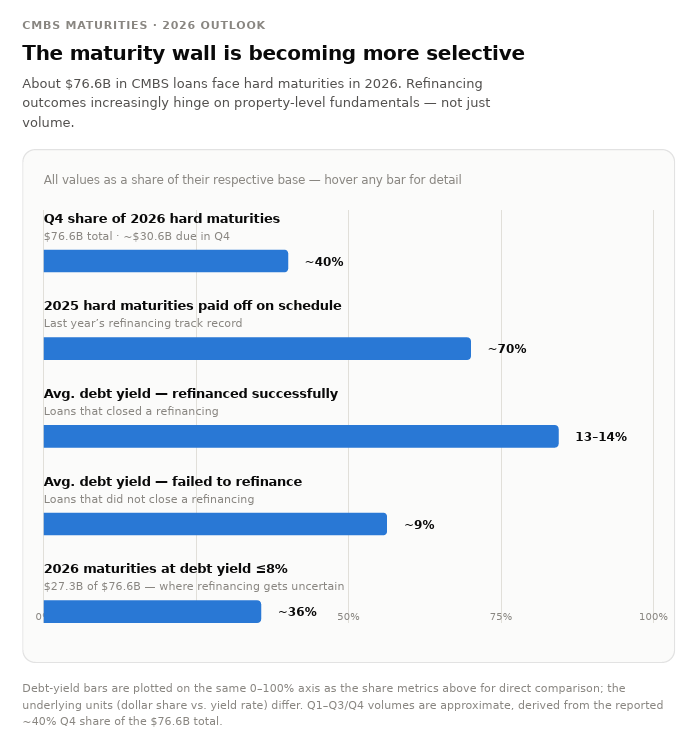
That math is now colliding with an October 28th Fed decision that could add, rather than subtract, from refinancing costs, precisely as the heaviest quarter of this year’s maturity calendar arrives.
What this confirms, and what it changes
My September thesis holds: debt yield, not simply the headline rate, remains a defining factor in whether a refinancing closes. The deals above both underwrite real, in-place cash flow and credible leasing, not a bet on rates coming down. The difference now is the financial impact of getting that assumption wrong. Sponsors who structured deals expecting interest rate cuts are now absorbing the shortfall through additional cash contributions or equity dilution. Three things to follow for institutions deploying capital into Q4…
Underwrite to today’s curve, not last quarter’s. A refinancing modeled around anticipated Fed cuts looks meaningfully different after a rate hike, with further tightening still possible. Debt yield assumptions must be reassessed, not simply rolled forward.
The equity gap is now a line item, not a risk factor. With billions of H2 maturities needing fresh equity and office carrying the largest exposure, institutions underwriting acquisitions or recaps in this segment should treat required cash-in as a quantifiable deal term.
Leasing quality is carrying more weight in underwriting than loan structure alone. Lenders are not financing office because office is back. They are financing it when a credible tenant commitment and submarket fundamentals back the bet up – a tenant-and-market conclusion, not a sector call, and the level of diligence this market now requires on every file.
The Bottom Line
A month ago, the market was pricing in a Fed that might hike. Now it has, with further tightening possible for October 28th, right as the heaviest quarter of 2026’s maturity wall arrives. Capital continues to move toward cash flow and leasing that can be underwritten with confidence, and away from everything that depends on a rate cut that hasn’t come.
That is the environment Summer Street Advisors is built for. Across more than $50 billion in debt and equity due diligence assignments, our work provides institutional investors and lenders with the underwriting discipline, valuation rigor, and on-the-ground diligence to distinguish deals can clear this bar, from those that only appear to- before capital is committed, not after.
Summer Street Advisors provides underwriting, appraisal review, asset management and risk assessment, and site inspection services to institutional investors, private equity firms, banks, and debt funds nationwide.
This commentary reflects the firm’s perspective on current market conditions as of October 13, 2026, and should not be construed as investment, legal, or financial advice. Market data referenced above is drawn from the Federal Reserve, Trepp, CBRE, and MSCI/CREDA Research Foundation; transaction examples reflect recent, publicly reported market activity.
Share This :